Iris Dataset
We will demonstrate how to fit a linear regression model to the iris dataset.
First we will load the data.
library(knitr)
library(tidyverse)

data(iris)

iris = iris |>
  rename_with(~ tolower(gsub(".", "_", .x, fixed = TRUE)))

iris |>
  head()
  sepal_length sepal_width petal_length petal_width species
1          5.1         3.5          1.4         0.2  setosa
2          4.9         3.0          1.4         0.2  setosa
3          4.7         3.2          1.3         0.2  setosa
4          4.6         3.1          1.5         0.2  setosa
5          5.0         3.6          1.4         0.2  setosa
6          5.4         3.9          1.7         0.4  setosa
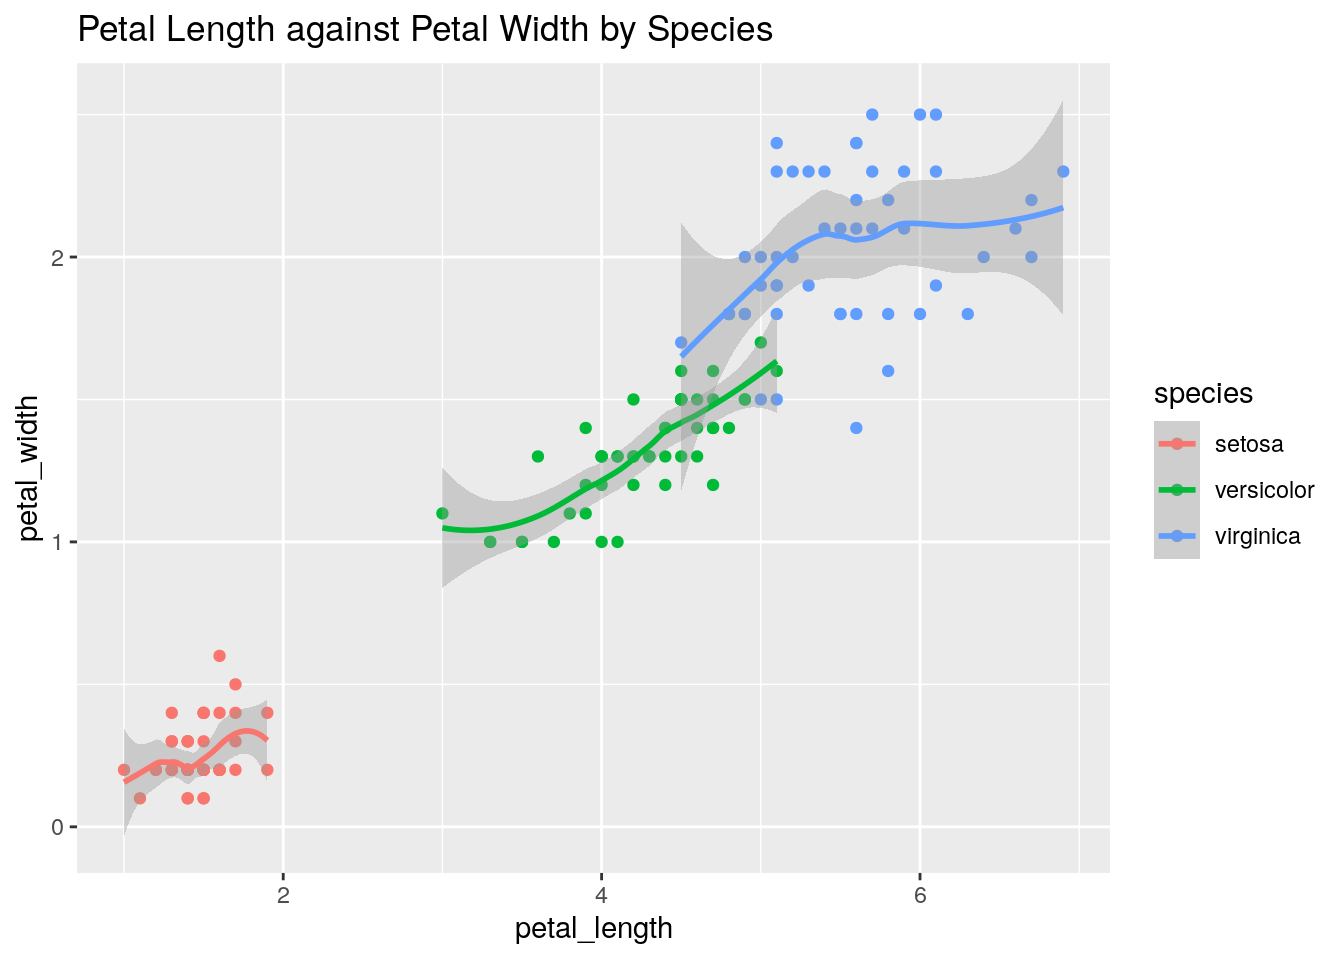
Next, we will visualise the data.
Regression
Next we will fit a linear regression model.
Call:
lm(formula = petal_width ~ petal_length, data = iris)

Residuals:
     Min       1Q   Median       3Q      Max
-0.56515 -0.12358 -0.01898  0.13288  0.64272

Coefficients:
              Estimate Std. Error t value Pr(>|t|)
(Intercept)  -0.363076   0.039762  -9.131  4.7e-16 ***
petal_length  0.415755   0.009582  43.387  < 2e-16 ***
---
Signif. codes:  0 '***' 0.001 '**' 0.01 '*' 0.05 '.' 0.1 ' ' 1

Residual standard error: 0.2065 on 148 degrees of freedom
Multiple R-squared:  0.9271,    Adjusted R-squared:  0.9266
F-statistic:  1882 on 1 and 148 DF,  p-value: < 2.2e-16
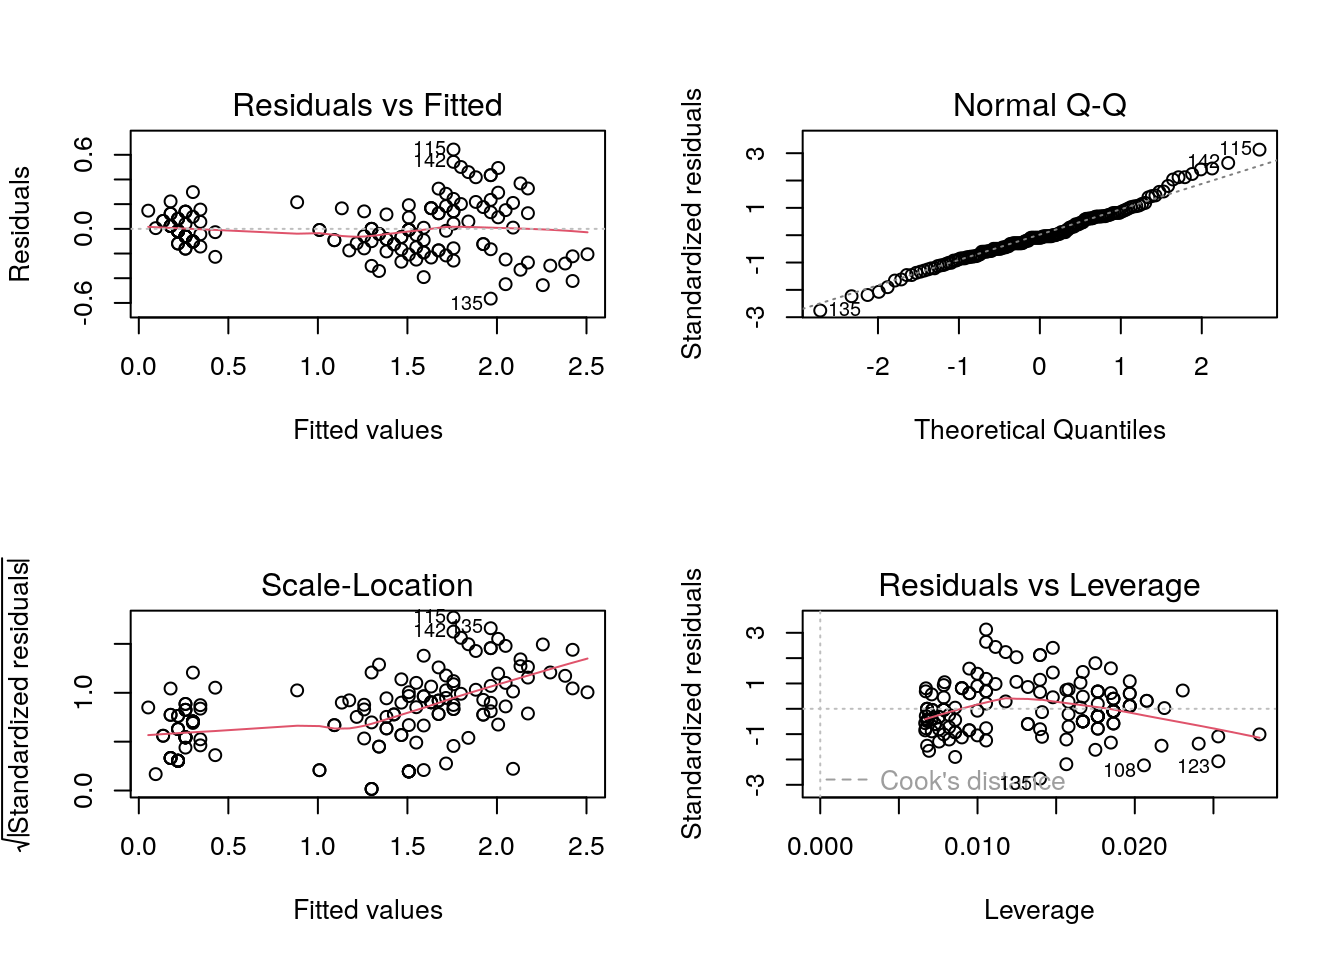
Diagnostics
Next, we will view some diagnostics.